Back to work

DNAnexus · Case study

Apollo Data Visualization

New chart types that let scientists plot categorical and numerical data side by side for the first time, turning a limited dashboard into a full analysis tool.

Role
UI/UX Design Intern
Team
2 designers, 2 PMs
Timeline
Summer 2019
Platform
Web
2new chart types, box plots and scatter plots, the first in Apollo to combine two datasets
3,000phenotypic fields they work across, alongside 15M genomic variants and 100K samples
2019European Innovations Award for Apollo's UK Biobank Cohort Browser

The problem

Scientists could study one trait at a time

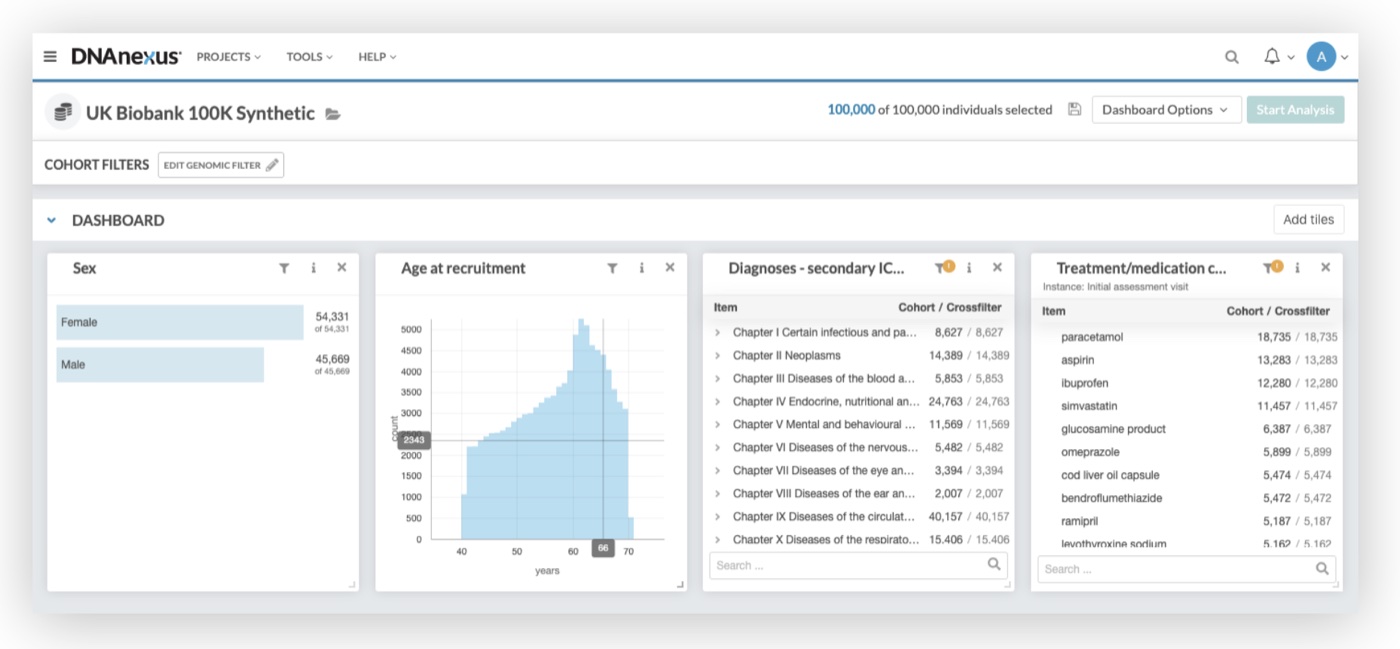
Apollo, DNAnexus’s data visualization platform, lets bioinformatics scientists build dashboards of charts from huge genomic datasets like the UK Biobank. But every chart could show only one variable: a count of people by sex, age or diagnosis.

So scientists could only learn about one phenotypic trait at a time. To spot real patterns, like how a parent’s illness relates to age, they needed to compare two datasets in a single view.

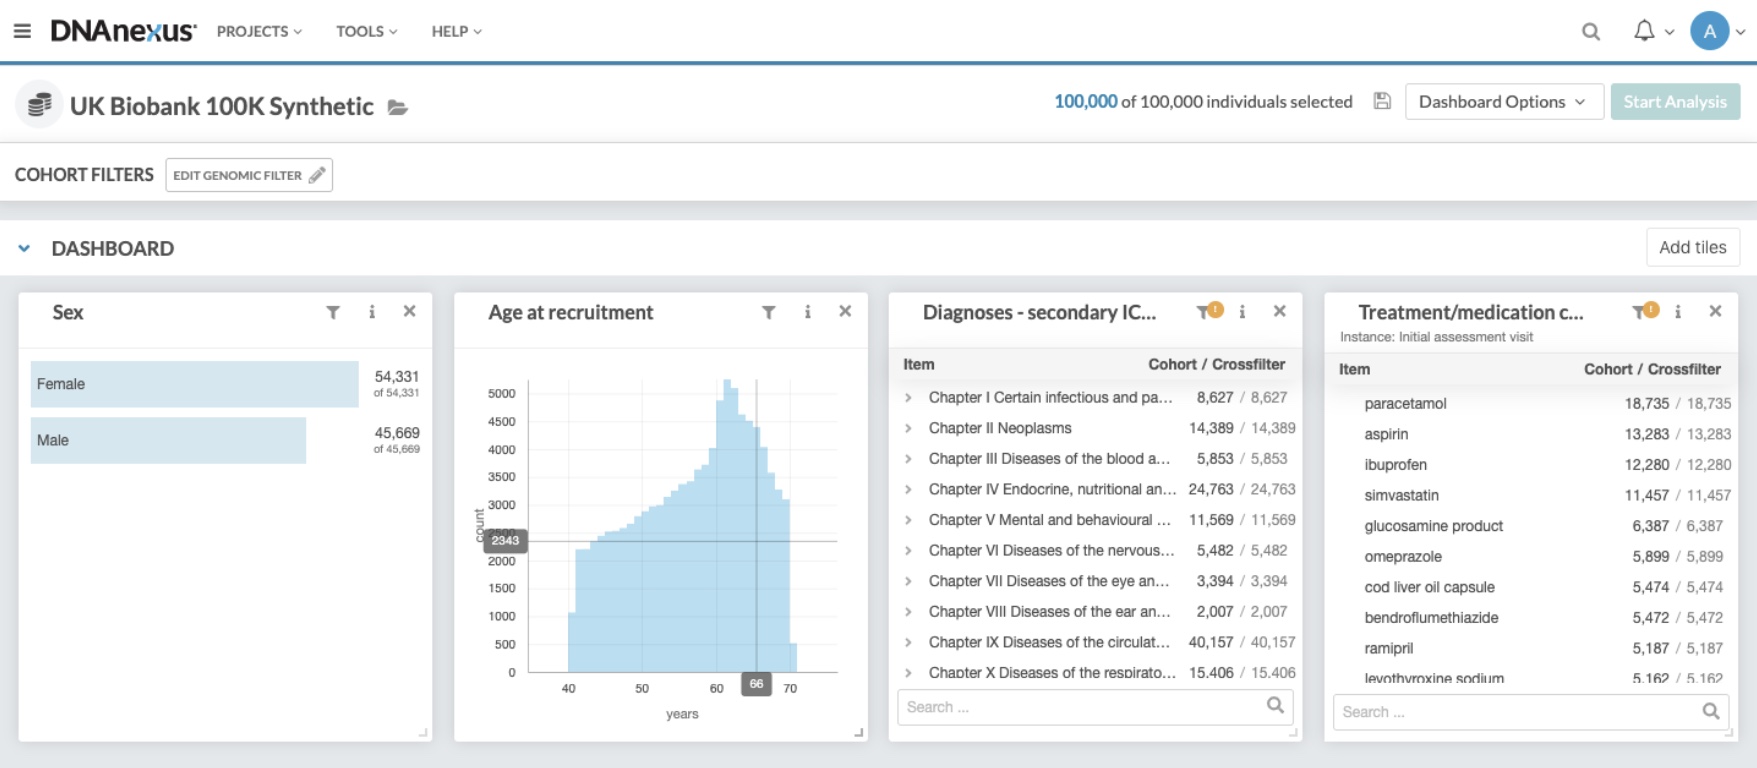
The Apollo dashboard before: tiles for sex, age at recruitment, diagnoses and medications, each showing a single variable
Before: every tile showed a single variable, as a bar chart or a table

Key decisions

Let the data pick the shape

Two chart types, one for each way data pairs up

What we learned
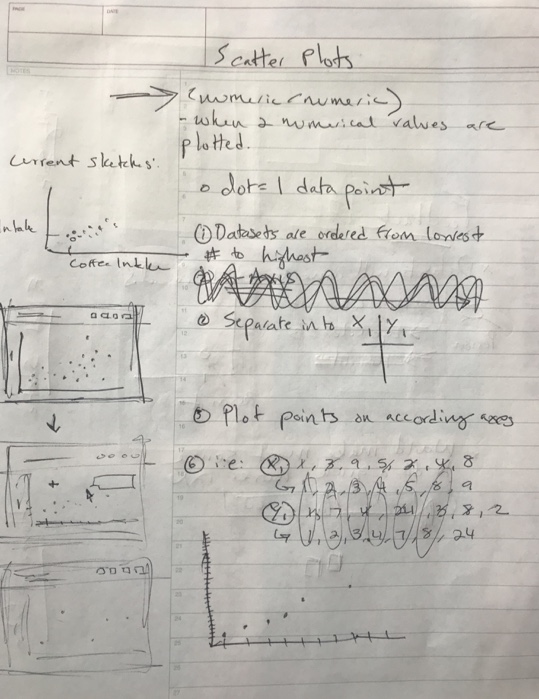
Scientists combine data in two ways: a category with a number, like illness of father by age, or two numbers, like height by weight.
What I did
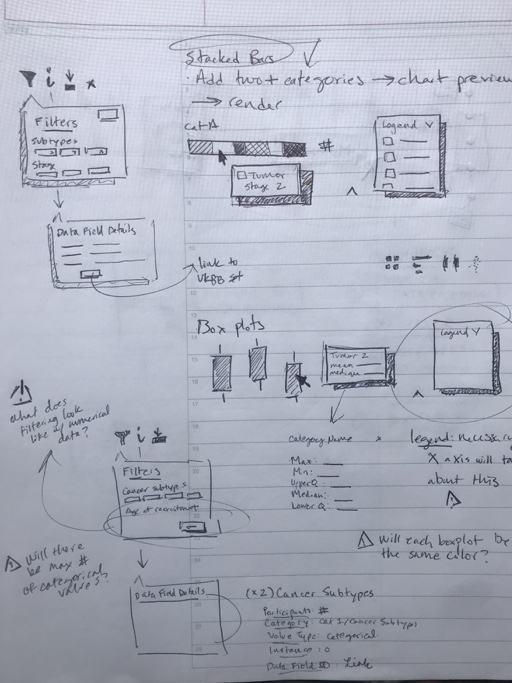
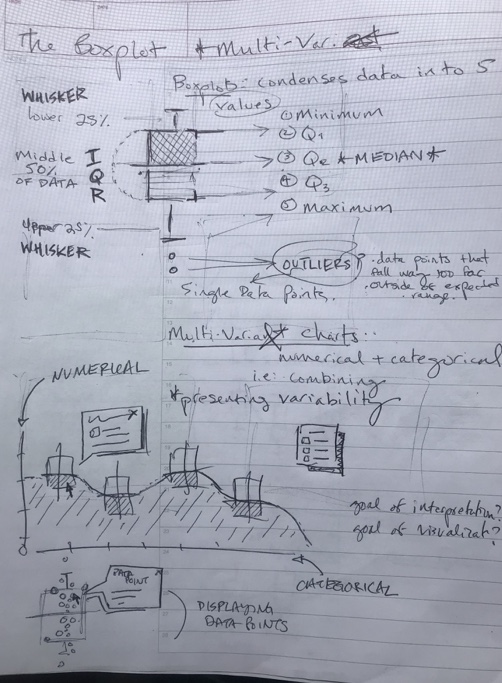
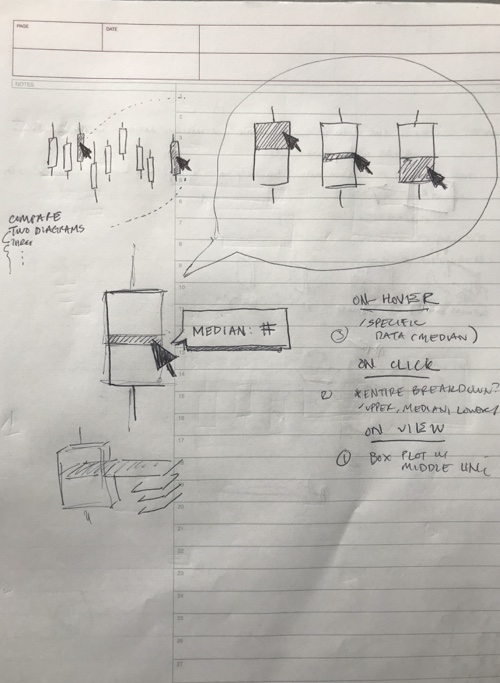
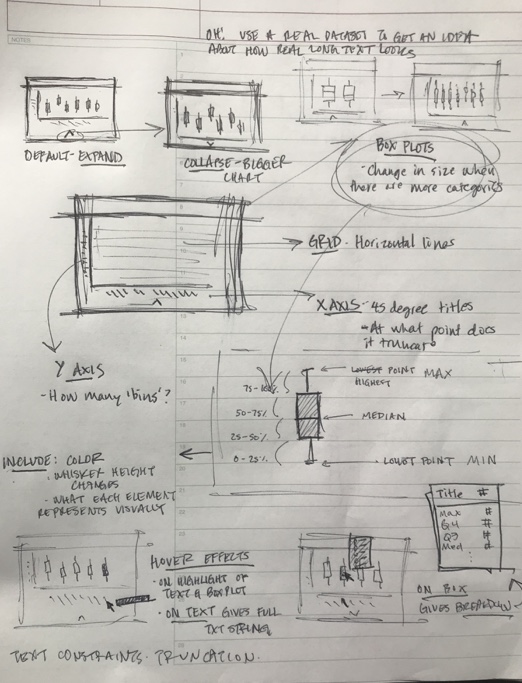
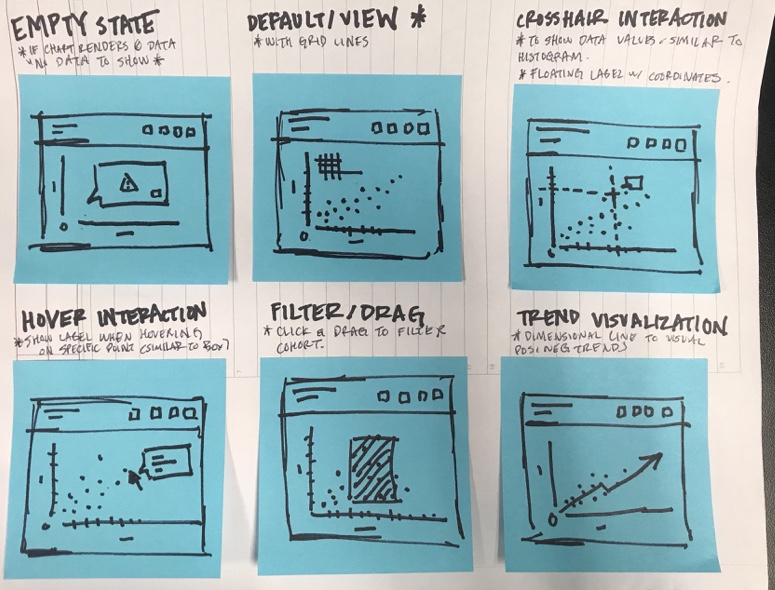
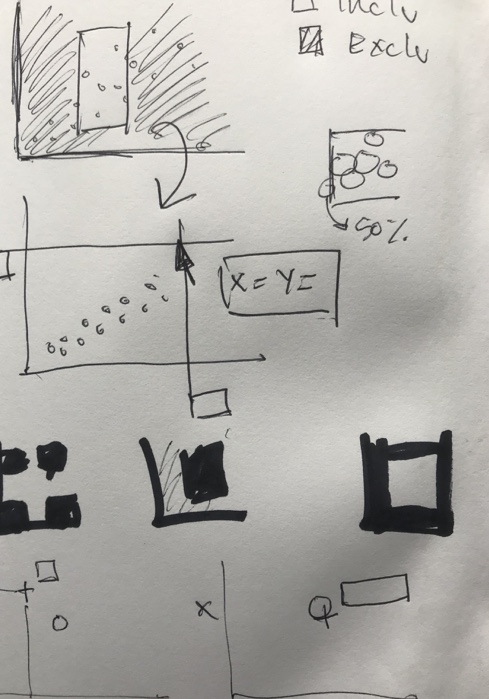
Box plots for a category and a number, scatter plots for two numbers. I sketched both on paper first and tested them with DNAnexus’s in-house scientists.
Box plot and scatter plot sketches, tested with the in-house scientists. Hover to pause

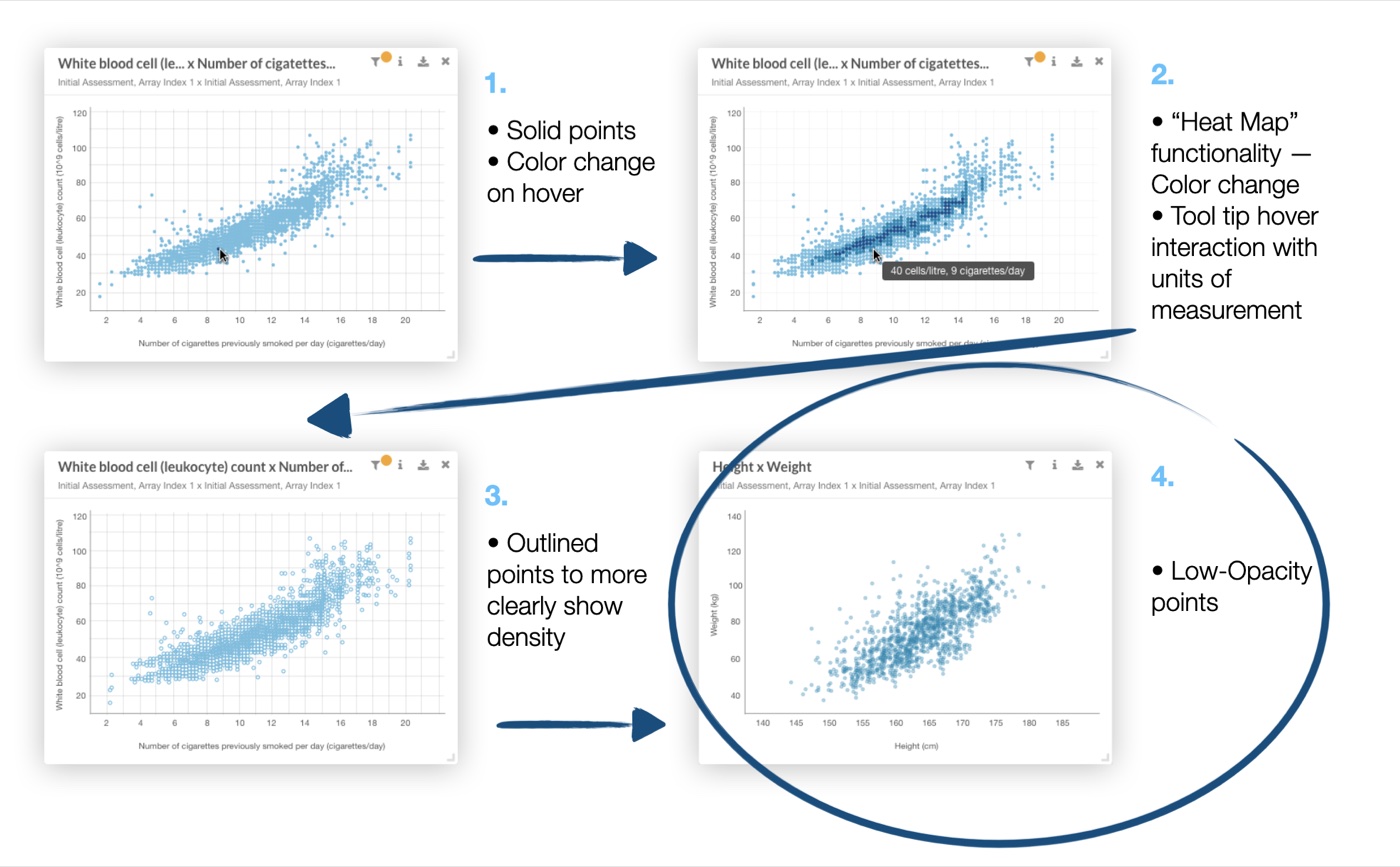
Show density with opacity, not color

What we learned
Big datasets stack thousands of points on top of each other. Solid points and a heat-map version both hid where the data clustered.
What I did
Low-opacity points, so density shows wherever points overlap, an approach I found studying tools like AntV.
Four rounds of the scatter plot: solid points, a heat map, outlined points, and the final low-opacity points
Four rounds, from solid points to the final low-opacity version

Crosshairs and angled labels, for calmer reading

What we learned
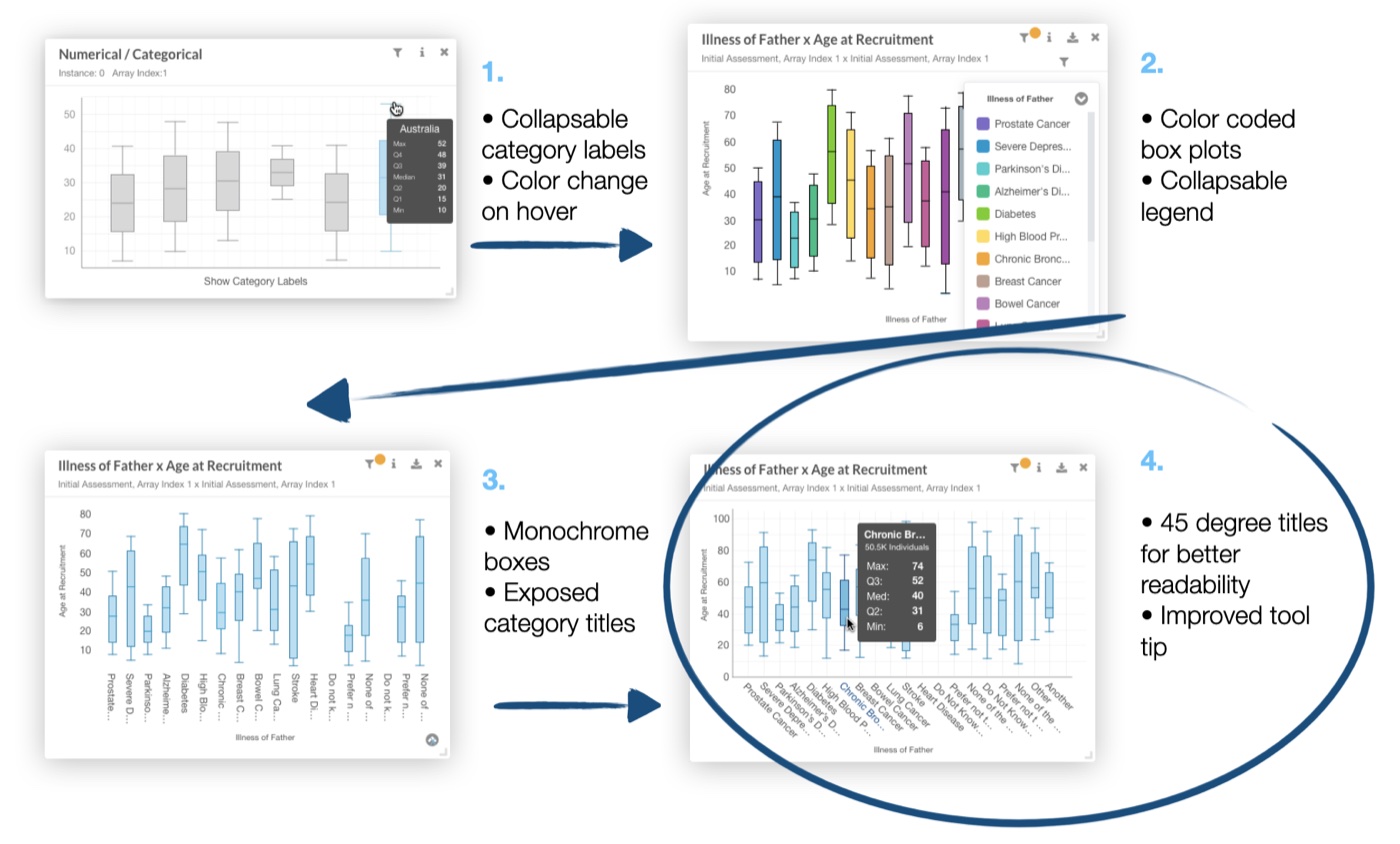
In testing, tooltips felt “flickery” as the mouse grazed thousands of points, and long genomic labels didn’t fit under the boxes.
What I did
A crosshair that reads the coordinates off each axis instead of a tooltip, and box plot labels at 45° to fit more characters in a small space.
Four rounds of the box plot, ending with 45 degree labels and a clearer tooltip
The box plot’s rounds, ending with 45° labels and a clearer tooltip

The solution

Two datasets, one chart

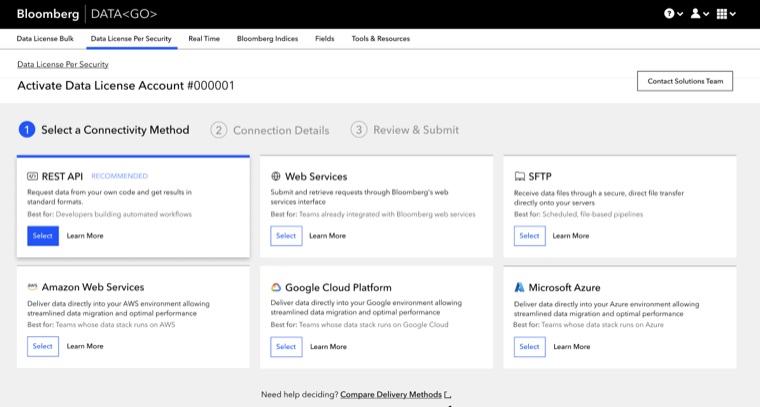
Scientists add two datasets in the chart drawer, pick a chart type, and explore with hovers, crosshairs and filters.

Adding a box plot: pick two fields, and the drawer suggests the chart that fits them

Illness of Father x Age at Recruitment

Initial Assessment, Array Index 1 x Initial Assessment, Array Index 1

  1. Hover a box or its label to see that group’s numbers
  2. Click a box to pin them while you compare
  3. Labels sit at 45° so long genomic names still fit
  4. Try it: this chart is live
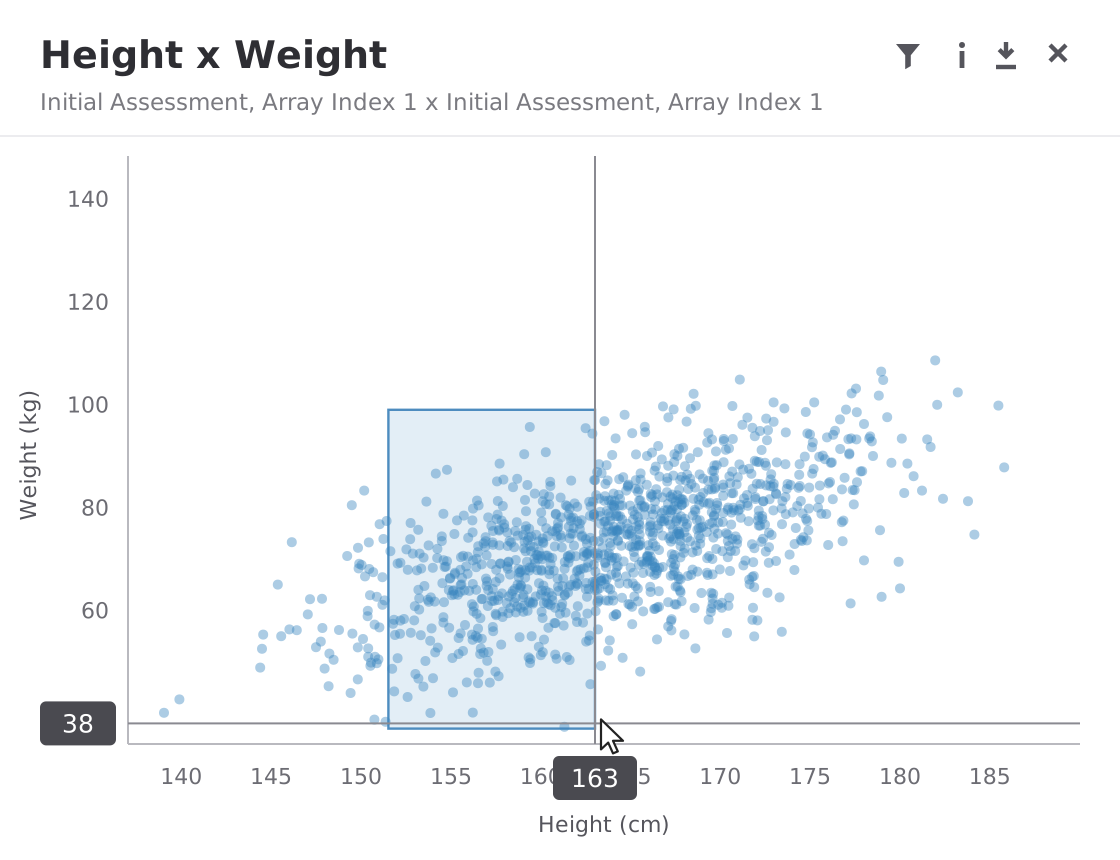
  1. Move across the chart: the crosshair reads each axis, with no flickering tooltip
  2. Drag to brush a selection. Everything outside it grays out
  3. Open the filter for exact ranges, between or not between
  4. Try it: this chart is live. Click once to clear

Height x Weight

Initial Assessment, Array Index 1 x Initial Assessment, Array Index 1

Impact & reflection

From one trait to an award

The science team could finally combine two variables in one chart. After my internship, Apollo’s UK Biobank Cohort Browser won the 2019 European Innovations Award and drew attention across the biotech community.

Scientists then used box plots on far bigger datasets than we planned for, and past a point the boxes got too thin to read. Next time I’d design for the extreme case early, for example by grouping or scrolling categories once there are too many.

I wasn’t a scientist going in. Testing with the in-house scientists at every step is what made the work useful.
End of case studyBack to top ↑